![]()


There are three steps TVNSP completes when making flight predictions.
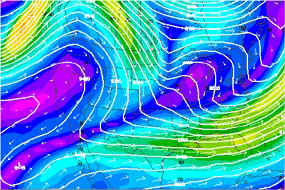
The semiparallel lines in the MRF are called isobars and represent points of equal pressure. When friction with the surface is not a factor, winds tend to be geostrophic and travel parallel to the isobars. Why does this occur? Two forces are in balance when the winds are geostrophic, the pressure gradient and the Corolis "force". Before going any further, let me say that the Corolis force is not really a force, but instead is an effect of a rotating frame of reference. But for this explanation we will treat the Corolis Effect as a force.
Pressure Gradient
The pressure gradient is a measure of how much "pressure force" exists
between the isobars. The narrower the isobars at any given point, the
greater the pressure gradient at that point. The greater pressure gradient
occurs because the air pressure has changed over a shorter distance when isobars
are more narrow. The direction of the pressure
gradient is perpendicular to the isobars and points towards the lower
pressure. Greater pressure gradients lead to faster winds because the force
from the change of air pressure between the isobars is greater. So when you
see isobars narrowing, you know the winds are picking up speed. However,
these winds should be blowing from high pressure to low pressure. What is it
that changes the direction of the winds?
Corolis Effect
In the
northern hemisphere, the Corolis Effect turns moving objects (like the wind)
towards their right. The effect
is very noticeable in the atmosphere where there can be high speeds and great
distances. Actually the winds are traveling straight, but the Earth beneath
them, where we stand, is spinning. Our frame of reference travels with this
spinning Earth. So we interpret the Earth as being stationary and the winds
as changing their direction. Note that in the southern hemisphere the "bending"
of the wind's direction is to its left. Also note that there is no Corolis
Effect on the equator, which keeps hurricanes from forming directly over the
equator.
At some point the direction of the pressure gradient is opposite the direction that the Corolis Effect is trying to force the winds. At this point then the winds are geostrophic and run parallel to the isobars. As long as there is no friction to slow down the wind's speed the pressure gradient balances the Corolis Effect. Above the ground then, the winds flow parallel to the isobars and clockwise around high pressure systems. When friction with the ground occurs, the drag caused by friction slows down the winds which also reduces the impact of the Corolis Effect. These winds are then ageostrophic and tend to cut across isobars with wind blowing away from high pressure and towards low pressure. Also note that near highs and lows, even above the ground, winds become ageostrophic.
When there is a ridge in the isobars, or where the isobars form a mountain shape, we have a high pressure ridge. Notice that when a high pressure ridge is to the west of a site, the winds tend to blow towards the southeast. Winds are named according to the direction they flow from. So winds coming from the north and going south are called northerly winds. So when a ridge of high pressure is to the west of a site, the site experiences northwesterly winds. Balloons are captive to the winds and never travel in a direction other the the direction of the wind. A balloon launched when a ridge of high pressure is located just west of a launch site tends to travel towards the southeast. Once a high pressure ridge passes the launch site, the winds will turn counter-clockwise. The winds then come from the southwest and a balloon will travel to the northeast.
A valley in the isobar pattern is called a trough of low pressure. When a trough is to the west of a site, winds come from the southwest. Troughs of low pressure usually follow ridges of high pressure, creating a seesaw pattern to the winds that varies over a scale of several days.
One other thing to note about ridges and troughs in the isobars. In front of a trough and behind a ridge tends to be cloudy weather. After the trough passes and before the next ridge arrives, the skies tend to be clear. So if clear skies are important to your launch, then you may want to wait until after a trough has passed and the winds come from the northwest.
When using the MRF, observe the predicted winds at 300 mb for the day of launch. Start making the observations several days in advance and watch for changes in the prediction. If you're located near mountains like TVNSP is in Idaho, then winds aloft are critical for deciding when to launch. For TVNSP, we will call-off a launch if we don't have a ridge off to our west or a trough off to our east. The southwest winds carry our nearcraft into the mountains, making recovery very difficult.
To observe the winds aloft prediction, go to Unisys' MRF site at http://weather.unisys.com/mrf/index.html. From there, select 4 Panel Plots then the forecast for the number of days until the launch. On the top left is the 850 mb panel and on the top right is the 300 mb panel. The 300 mb plot is important because it usually contains information on the jet stream. The jet stream has a big influence on the recovery site's range and azimuth. For information on wind speeds, look at the lengths of the arrows in the pressure plots. Longer arrows imply faster wind speeds. Notice that these faster wind speeds occur where isobars are more narrow. You will also notice there is a color coding to the pressure plots. Regions of faster winds are colored yellow and green whereas regions of slower winds are colored blue and purple. Another observation to make is that when the jet stream is south of your launch site, the air temperatures will be lower than when the jet stream is north of your launch site.
The INI file needs information like
| The latitude and longitude of the launch site | |
| Ascent and descent rates of the balloon | |
| Predicted burst altitude of the balloon |
To get winds aloft reports, go to the University of Wyoming's Department of Atmospheric Science website. Select to download the winds aloft in text format. Then click on the National Weather Service site closest to the launch site. The sites are indicated in a map of the US, so you don't have to be familiar with your local NWS. The winds aloft report is at http://www-das.uwyo.edu/upperair/sounding.html
At TVNSP I like to run predictions everyday for a few days in advance of a launch. Each report is kept and the shift in the predicted landing point is monitored. Dramatic shifts in the predicted landing point spells uncertainty. It indicates the winds aloft are changing too fast, and that any prediction the day before the launch may contain a high degree of uncertainty. In regions of the country with relatively flat terrain, this uncertainty may not be much of a problem. In states like Idaho, it can spell the difference between a flight recovered before lunch and a flight recovered after an alpine mountain climb.
While monitoring the shifts in the predicted landing point, also monitor the changes in the MRF. You should note a correlation. As a high pressure ridge moves in, the predicted landing point should move south. After the ridge passes and a trough approaches, the landing point should move north. As the isobars over the launch site get narrower, the landing point should move farther away. And as the isobars over the launch site get wider, the predicted landing point should move closer to the launch site.