


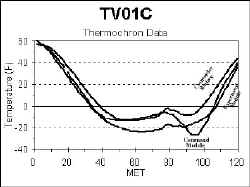
iButton Thermochron
TVNSP crews placed Dallas Thermochrons in the command and experiment
modules of the near space capsule. A third Thermochron was placed inside the
camcorder cover to monitor the camcorder battery temperature. The temperatures
track one another as well as I expected, except the camcorder battery cover
didn't record the lowest temperature as I expected.
TV01C
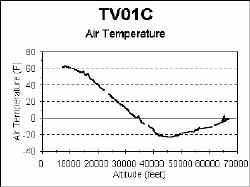
Environmental Sounder
The sonde unit TVNSP launched in this mission shows the typical
temperature profile. This time the stratosphere is detected at an altitude of
45,000 feet. As the weather warms up, we expect the altitude of the stratosphere
to rise from its winter time level.
TV01C
Near Space Cabin
In TVNSP's continuing effort to perfect a life support system for
insects traveling into near space, we launched a modified cabin for flight
TV01C.
Cabin Pressure
This time washers were placed into the caps of both bottles. Life support
sensors show the bottles leaked a little air until cabin one suffered
catastrophic pressure loss at 46 minutes into the flight at an altitude of
approximately 45,000 feet. Cabin two did not suffer this fate and maintained its
integrity throughout the flight.
Cabin One used a slightly smaller washer and had no Teflon tape wrapped
around its threads. Future tests of the cabins will either use the larger washer
or Teflon tape. This will determine which factor is more important to
maintaining environmental integrity during a flight.

Cabin Temperature
Both cabins were covered during this flight. Cabin two was wrapped in a layer of
black paper and cabin one was wrapped in a layer of aluminized mylar. From the
measurements taken during the flight, the covering material is largely
irrelevant, as long as the cabins are covered.

TV01C
GPS Reciever
Winds aloft show an interesting double peak at altitudes near 40,000
feet. Usually we see a single narrow peak wind speed as the capsule passes
through the jetstream. In this flight the peak wind speeds occured over a wider
range of altitudes.
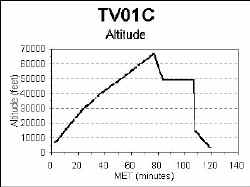
 The onboard GPS
allows TVNSP
to monitor flight performance. The first graph shows altitude of the capsule
during the mission. There's that "knee" in ascent rate around 22
minutes into the flight. The cause of this change is ascent rate is not known at
the time, but shows up in every flight. Notice also the lockup of the GPS during
recovery when it stopped updating the altitude.
The onboard GPS
allows TVNSP
to monitor flight performance. The first graph shows altitude of the capsule
during the mission. There's that "knee" in ascent rate around 22
minutes into the flight. The cause of this change is ascent rate is not known at
the time, but shows up in every flight. Notice also the lockup of the GPS during
recovery when it stopped updating the altitude.
 With the time stamp and
altitude given in the GPGGA sentence, we can generate a graph illustrating the
ascent rate during the flight. The "knee" is visible as the ascent
rate drops from around 18 fps down to around 10 fps. Immediately after balloon
burst the capsule falls at a rate of 55 fps or 26.5 mph. As the atmosphere grows
denser, the descent rate drops to a safe 18 fps or 12 mph.
With the time stamp and
altitude given in the GPGGA sentence, we can generate a graph illustrating the
ascent rate during the flight. The "knee" is visible as the ascent
rate drops from around 18 fps down to around 10 fps. Immediately after balloon
burst the capsule falls at a rate of 55 fps or 26.5 mph. As the atmosphere grows
denser, the descent rate drops to a safe 18 fps or 12 mph.
